
Global gas markets after the Hormuz shock
The conflict in the Middle East and the disruption of shipping through the Strait of Hormuz have sent shockwaves through global gas markets. Before the war, around a fifth of global liquefied natural gas (LNG) trade transited through the strait, largely from Qatar, the world’s second-largest LNG exporter after the United States.
The first Iranian drone attacks on Ras Laffan and Mesaieed in early March 2026 prompted QatarEnergy to halt LNG production and declare force majeure on some long-term contracts. Days later, an even more damaging missile strike hit the Ras Laffan industrial complex, the world’s largest LNG export facility. The strike caused fires and extensive damage to two LNG trains (liquefaction processing units), taking around 17 percent of Qatar’s export capacity offline.
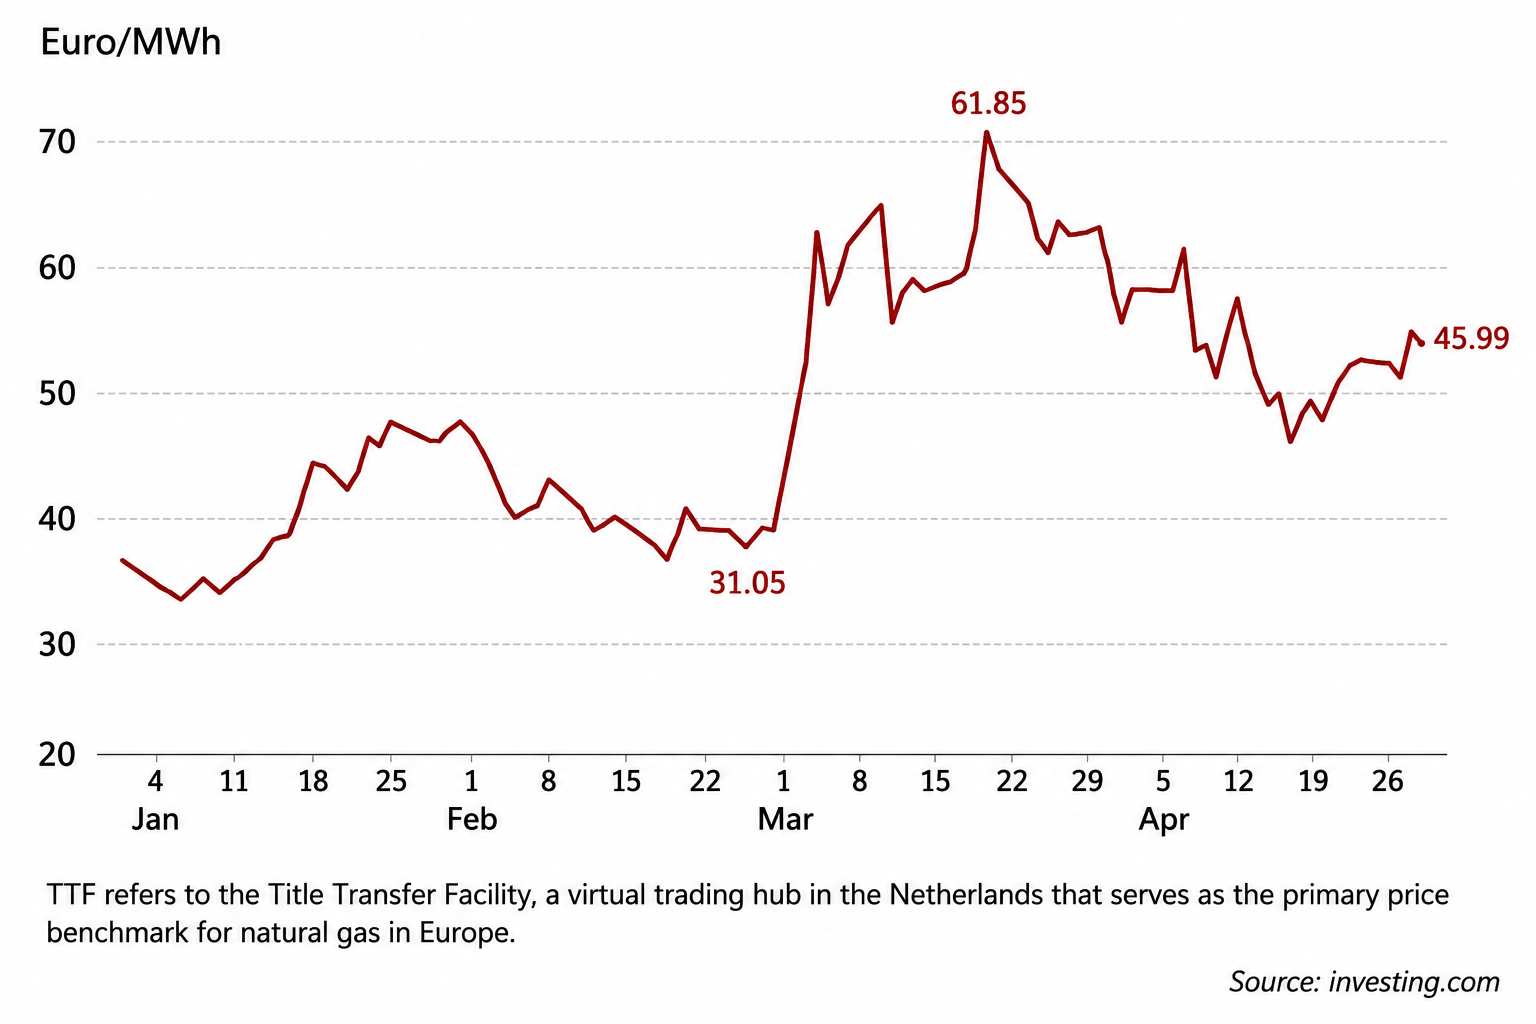
European and Asian gas prices surged sharply in the immediate aftermath of the attacks. Asian importers scrambled to secure replacement cargoes amid fears of prolonged shortages. Commentators warned of an “Armageddon” scenario for global gas markets, with some describing a potential “apocalypse” for the LNG trade and a “bloodbath” for import-dependent economies, mirroring the panic that followed Russia’s invasion of Ukraine in 2022. Others argued that the crisis had exposed the fragility and unreliability of LNG as a pillar of energy security.
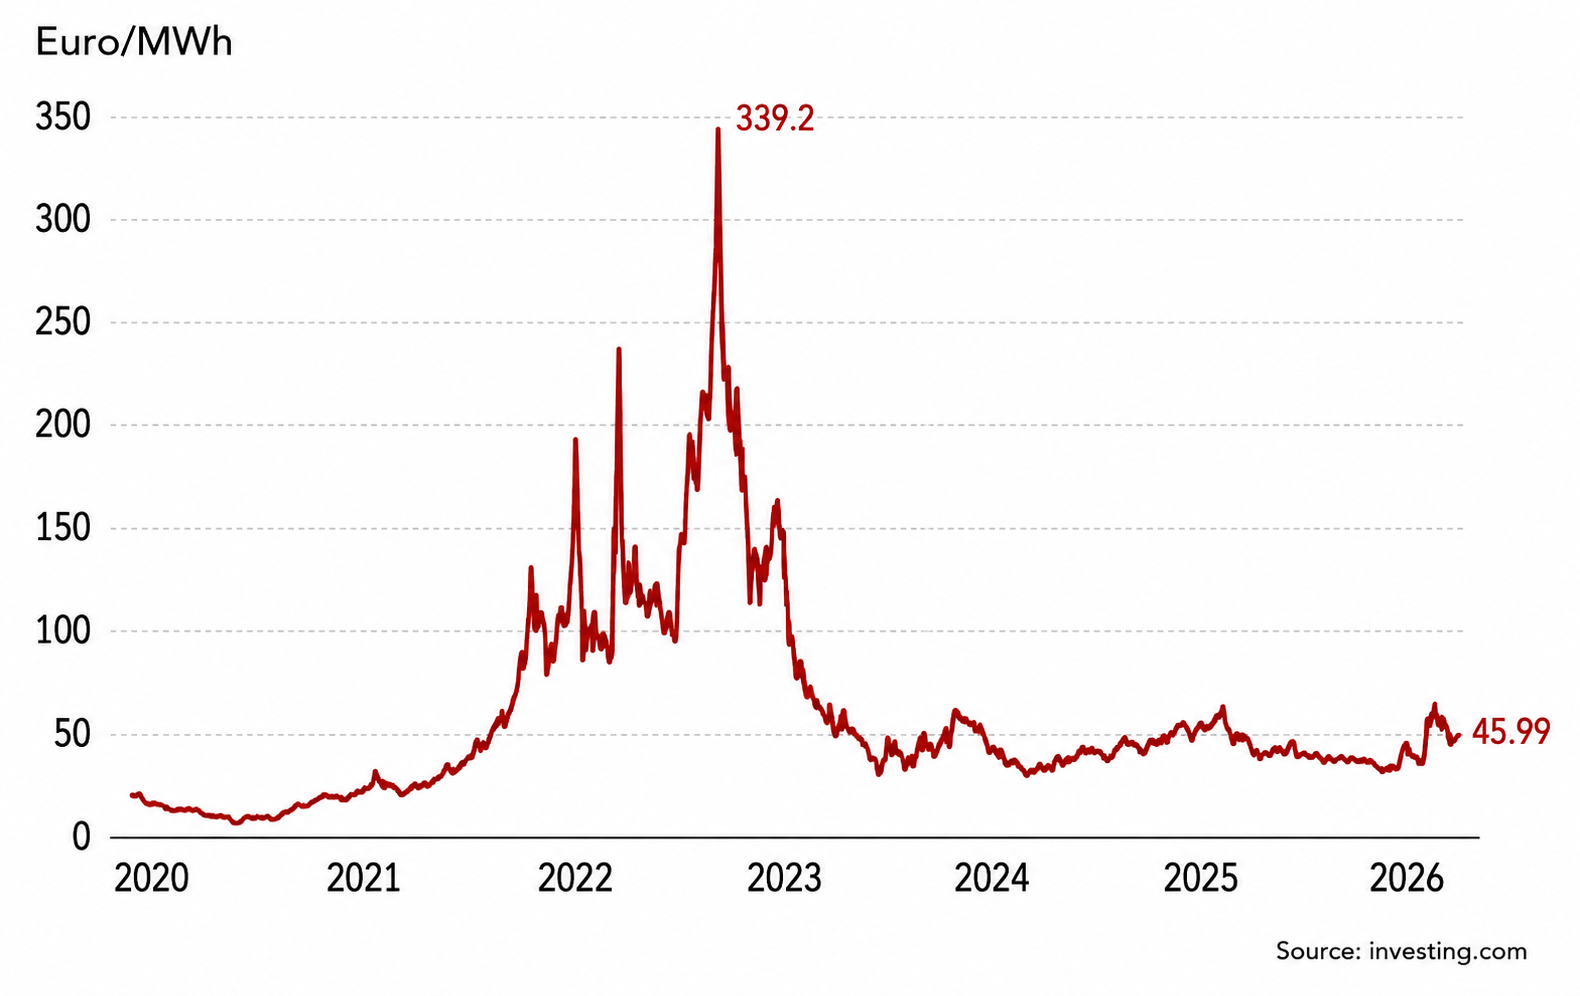
Yet the market response, while significant, was far more measured than during the 2022 crisis. Prices rose sharply but stayed well below the levels reached after Russia’s invasion of Ukraine and the subsequent collapse in Russian gas supplies to Europe. Additional LNG exports from the U.S., the start-up of new supply projects, the demand adjustment in key consuming markets and fuel switching – particularly a return to coal in parts of Asia – all helped cushion the shock.
The Hormuz crisis nevertheless highlighted the evolving nature of gas markets. LNG has increased flexibility for both producers and consumers, allowing supplies to move more freely across regions and helping markets respond more quickly to disruptions. But this growing interconnection also exposes gas markets more directly to geopolitical risks and price volatility.
At the same time, gas markets remain structurally different from oil markets. Only a limited share of global gas production is traded internationally, and substitution remains easier in many gas-consuming sectors, even if this often comes at the expense of climate objectives. The events surrounding Hormuz therefore do not fundamentally alter the outlook for LNG. They do, however, underline the risks associated with a concentrated supply base and a more interconnected global gas market.
Facts & figures: European spot gas price (TTF), Jan-April 2026
Structural changes in gas markets
The reaction to the Hormuz crisis cannot be understood without recognizing how profoundly gas markets have changed over the past two decades. What was once largely a regional business, dominated by long-term pipeline trade and isolated pricing systems, has become increasingly interconnected through the rapid expansion of LNG. This transformation has been driven by several factors: technological progress across the LNG value chain, the geographical mismatch between reserves and centers of demand, the development of large new gas provinces, and ironically, the energy transition itself, which has promoted natural gas as a preferred alternative to more carbon-intensive fuels such as coal.
Since the first commercial LNG shipments in the late 1960s, technological improvements have steadily reduced costs across liquefaction, shipping and regasification. Combined with the expansion of supply from countries such as the U.S., Australia, Qatar and, more recently, East Africa, LNG has become one of the fastest-growing internationally traded commodities. Between 2011 and 2021, interregional LNG trade grew more than four times faster than pipeline trade. In 2020, for the first time, the volume of gas traded globally as LNG exceeded that traded by pipeline.
The number of LNG exporters and importers has also expanded significantly over the past two decades. New technologies, including floating LNG and floating regasification units, have lowered barriers to entry and accelerated deployment timelines. Germany’s rapid construction of its first floating LNG import terminal in 2022 – completed in record time (less than seven months) following the collapse of Russian gas supplies – illustrated how quickly LNG infrastructure can now be deployed under pressure.
Facts & figures: Global natural gas and LNG market shifts
- Russian pipeline gas exports to Europe fell from around 150 billion cubic meters (bcm) in 2021 to less than 30 bcm in 2023 – a decline of more than 110 bcm per year. This is equivalent to roughly 15% of the gas traded globally and around 40% of Europe’s gas imports at the time.
- In 2002, Indonesia was the world’s largest LNG exporter, with exports of nearly 36 bcm. By 2025, the U.S. had become the largest LNG exporter globally, exporting around 164 bcm.
- Asia and Europe are the world’s two largest net importing regions for natural gas.
- China became the world’s largest LNG importer in 2021, overtaking Japan.
- The world’s three largest holders of proven natural gas reserves – Russia, Iran and Qatar – account for more than half of global proven reserves.
- In LNG markets, a force majeure declaration allows suppliers to suspend contractual obligations temporarily when extraordinary events beyond their control prevent production or delivery.
These developments are pushing gas markets further toward a more globalized structure, a feature long associated with oil markets. LNG increasingly allows cargoes to move between regions in response to price signals and supply disruptions, giving both producers and consumers more flexibility and options. Europe’s ability to attract U.S. LNG cargoes following the fallout with Russia is perhaps the clearest example of this new flexibility in action. For producers, LNG also offers strategic diversification opportunities, allowing exporters to redirect supplies across multiple markets rather than remain tied to a single pipeline customer.
Yet important structural differences between gas and oil markets remain. Unlike oil, where more than three-quarters of production is traded internationally in an integrated global market, most gas production is still consumed domestically or within regional markets. Only around 21 percent of global gas production is traded intra-regionally, and of that traded share, just over half (53 percent) moves as LNG, with the remainder transported by pipeline. Despite increasing interconnection, gas markets therefore remain less globally integrated than oil markets.
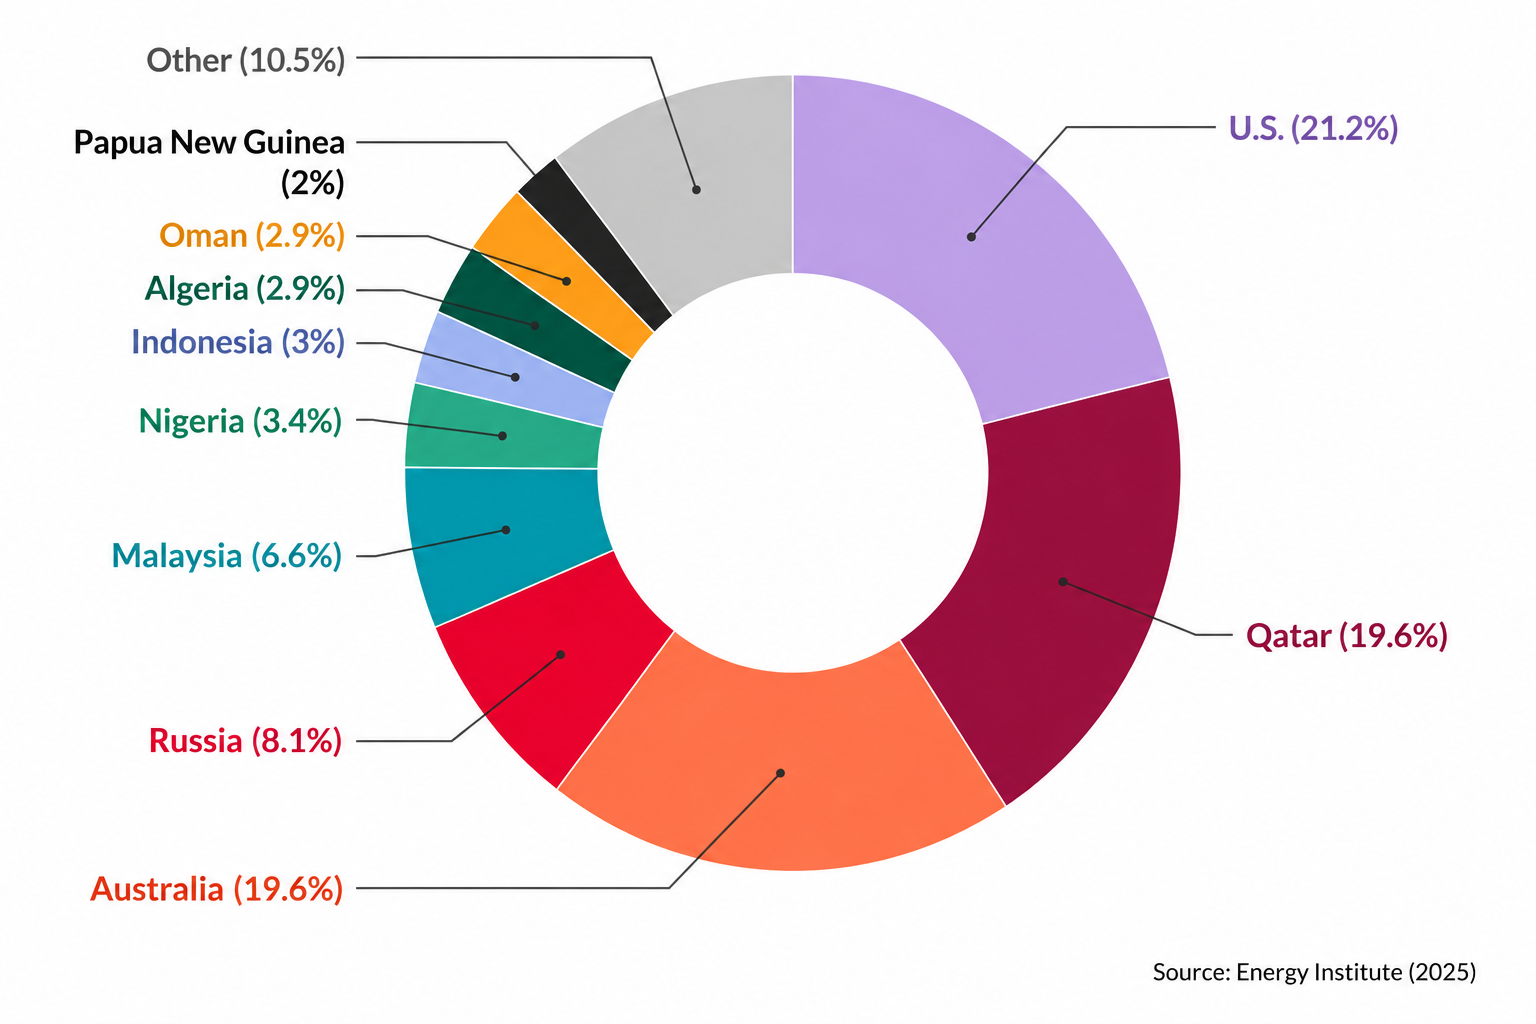
At the same time, LNG exports are far more concentrated than oil exports. In 2024, Australia, Qatar and the U.S. accounted for more than 60 percent of global LNG trade, while the fourth-largest exporter, Russia, held less than half the market share of each of the top three suppliers. By comparison, the world’s three largest oil exporters together account for roughly 36 percent of global oil exports. This concentration has important energy security implications for consuming countries, particularly during periods of geopolitical tension. Any disruption affecting one of these major suppliers is bound to trigger market anxiety and heightened volatility, particularly in spot LNG markets where prices respond rapidly to perceptions of scarcity and supply risk.
Facts & figures: LNG exporters, share of world, 2024
Putting the shock in perspective
The reaction to the attacks on Qatar’s LNG supplies and the resulting disruption was understandable. Qatar is a major exporter, Ras Laffan is the world’s largest LNG export complex and the Strait of Hormuz is a critical route for LNG trade. But some of the commentary that followed was excessive. The market reaction itself tells a more measured story. Prices increased sharply, but they remained a fraction of the levels reached in 2022.
There are several reasons for this. The attacks reportedly removed about 17 percent of Qatar’s LNG export capacity, potentially for several years. That is a major loss for Qatar and for its customers. But in the context of global LNG trade, it accounts for less than 4 percent of exports. The shock was therefore significant, particularly for LNG markets, but not of the same magnitude as the loss of Russian pipeline gas to Europe in 2022.
Moreover, even during the disruption, LNG flows from Qatar did not remain frozen indefinitely. While many cargoes were delayed or forced to turn back, some Qatari LNG shipments eventually resumed transit through Hormuz under special arrangements and approved routes, albeit with higher insurance costs and elevated security risks. This again helped prevent the sustained physical supply collapse that many early market reactions appeared to anticipate.
Before the conflict, global LNG markets were expected to move gradually toward a looser balance as new supply came on stream in the second half of the decade. A substantial share of this growth was expected to come from Qatar, though not all of it. The U.S. is central to the expansion trend. In April 2026, Golden Pass – a joint venture between QatarEnergy and ExxonMobil – shipped its first LNG cargo from Texas, adding another important source of U.S. supply. Canada has also entered the LNG export market, with LNG Canada loading its first cargo from Kitimat (on the north coast of British Columbia) in June 2025.
The conflict is expected to delay part of the new LNG capacity scheduled for later this decade. This will tighten the outlook compared with pre-war expectations. However, it does not fundamentally change the broader direction of travel. The supply of LNG is still expanding, and the crisis may well spur additional investment interest in projects beyond the U.S. and Qatar, as consuming countries seek greater diversification and energy security, even if few producers can match Qatar’s scale, cost position and speed of expansion.
Facts & figures: European spot gas price (TTF), 2019-2026
The demand side is equally important. Here again, gas differs from oil. Natural gas has substitutes in each of its main applications. In power generation, it can be replaced by coal, nuclear, hydro or renewables; in industry, by oil products, coal or electricity; and in heating, by electricity or other fuels. Such substitution is not always efficient, cheap or desirable and in the case of coal, it is clearly bad news for emissions. But it provides consuming economies with options.
In Asia, several countries responded by reducing spot LNG purchases, increasing coal-fired generation or relying more heavily on alternative fuels and existing inventories. India increased coal use in power generation, while buyers in Bangladesh and Pakistan scaled back spot LNG procurement amid surging prices. These adjustments helped cushion the immediate impact of the supply disruption, even if they came at the expense of environmental objectives.
Scenarios
Most likely: LNG expansion with greater focus on energy security
The Hormuz crisis is unlikely to reverse LNG expansion or fundamentally undermine the role of natural gas in global energy systems. If anything, it has reinforced the importance of diversification and supply flexibility. The disruption exposed vulnerabilities stemming from the concentration of LNG exports among a small number of suppliers, but it also demonstrated a degree of resilience in the system. Additional LNG flows from outside the Middle East and demand-side adjustments in key markets all helped cushion the shock.
Rather than triggering a retreat from LNG, the crisis is more likely to accelerate efforts by consuming countries to diversify suppliers, expand import infrastructure and strengthen energy security strategies. Several Asian countries have already renewed interest in domestic gas development alongside LNG imports.
The crisis may also slow – though not reverse – the gradual shift toward spot pricing and short-term procurement. Periods of notable volatility tend to reinforce the value of long-term contracts and stable supplier relationships. Buyers are likely to pursue a more balanced approach combining long-term contracts for security with spot purchases for flexibility.
Volatility will probably remain a structural feature of increasingly interconnected gas markets. This is not necessarily evidence of market failure but rather the price of flexibility in a more globalized LNG system.
Less likely: Slower momentum for LNG expansion
A less likely scenario is that repeated geopolitical disruptions erode political and commercial confidence in LNG as a pillar of energy security. The Hormuz crisis has already prompted some critics to question whether growing dependence on internationally traded gas simply imports greater geopolitical risk and volatility into domestic energy systems.
Under such a scenario, countries may place more emphasis on alternative energy sources, domestic gas development and regional energy solutions rather than continued expansion of LNG imports. Investment decisions could become more cautious, particularly in highly import-dependent economies exposed to spot market volatility and maritime chokepoints.
Even in this scenario, LNG is unlikely to lose its role in global energy markets. The underlying drivers behind gas demand, particularly in Asia, remain significant. But the pace of LNG expansion and market integration could slow compared with expectations before the Hormuz crisis.
Our Partners